IT Supplier News, Insight, and Market Intelligence.
End of Year Edition
The January 10 Infographic - Suppliers with fiscal year-end in January 2024 who will be applying maximum pressure at renewal time (Salesforce, Workday, Coupa, Okta and more). Who they are, what to expect, and how to handle.
IBM Mainframe Optimization Series - Part 10 of 10 (Managing Workloads)
Most popular articles of 2023 featuring insight on Salesforce, IBM, and more.
Tools for 2024 - free benchmark tools for Cloud Cost (AWS, Azure, GCP), SAP, Salesforce, VMware, and more...
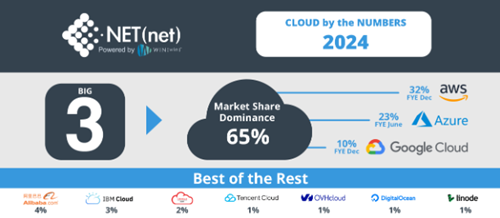
Cloud Outlook 2024 Infographic - Current market share, where and how to save in 2024.
Scroll Down to Read More:
Click on the image above or the button below to access the full infographic and read how these suppliers will utilize every strategy and tactic just before renewal time to boost their own bottom line before their January 31 fiscal year end.
By Steven Zolman - When it comes to Mainframes, NET(net) sees incredible savings opportunities in 2023 and 2024. Not since 2008 has there been as much downward pricing pressure on technology incumbents, and we believe meaningful savings targets can be achieved, but due to the market conditions, technology incumbent suppliers are seeking to increase prices and will attempt to be highly disruptive to any cost savings agenda!
Part 10: Managing Mainframe Workloads
Click below to read full article and links to parts 1-9:
Knowledge is power, or in our case Federated Market Intelligence is our super power. Over 21 years and thousands of IT optimization projects, NET(net) has amassed a staggering amount of market data. For select suppliers, we have created free tools to help you assess at a high level how you compare to the market, and what the potential is for savings. Below we offer links to these tools for complimentary use!
Contact us with any questions about these tools, your suppliers, or anything at all... (note: we do require a form completion so we may validate actual users from bots, spam, and more):
Cloud spend is capturing an ever increasing amount of IT budgets globally. Shockingly, the percentage of waste has not abated and drains budget and hampers productivity across even the most savvy enterprises. In this easy to view infographic we lay out the provider market share, waste in the industry, causes for that waste, and most importantly - what to do about it.
Click the picture above or the button below to view and learn more: